Regular readers of the SiteSeer blog know we partner with top-tier data providers offering a wide array of insights—from detailed population estimates to cell phone movement data and planned construction projects. And, of course, we like to mix in a bit of seasonal fun whenever we can.
With Halloween just around the corner, we’re once again showcasing the kind of powerful demographic data available through our trusted partner, Synergos Technologies, Inc. (STI). STI’s PopStats dataset delivers comprehensive population data that includes the current quarter plus eight previous quarters, along with valuable trend information.
Subscribers to PopStats within SiteSeer leverage this rich demographic data to track genuine population growth, a critical factor for forecasting sales, spotting emerging market opportunities, and strategically planning for expansion.
Halloween Spending and Consumer Trends: What the Latest NRF Survey Says
According to the National Retail Federation’s annual consumer survey conducted by Prosper Insights & Analytics, Halloween spending is expected to hit a record $13.1 billion in 2025, breaking the previous high set in 2023. This figure surpasses last year’s $11.6 billion and reflects growing enthusiasm for Halloween celebrations across the United States.
Per-person spending is also reaching new heights, with consumers expected to spend an average of $114.45 apiece this year. That’s almost $11 more than last year and continues the upward trend seen over recent years. Despite 79% of shoppers anticipating higher prices due to tariffs, families are eager to hand out candy, decorate, and dress up in costumes.
Halloween Activities: Classic Traditions Remain Popular
The NRF survey shares that Americans are staying true to time-honored Halloween traditions:
- 66% of consumers plan to hand out candy
- 51% will dress up in costumes
- 51% plan to decorate their homes or yards
- 43% intend to carve pumpkins, keeping this fall favorite alive
Early shopping continues to be a trend too, with 49% of consumers starting their Halloween purchases in September or earlier. The main reasons include looking forward to fall, avoiding last-minute stress, and securing popular items before they sell out.
Top Costumes for Kids in 2025
Costume choices reflect classic favorites and popular culture:
- Spider-Man remains the top pick (2.3 million children)
- Princess costumes follow closely (1.9 million children)
- Ghosts came in at 1.8 million
- Witches came in at 1.6 million
- And other superheroes totaled 1.5 million
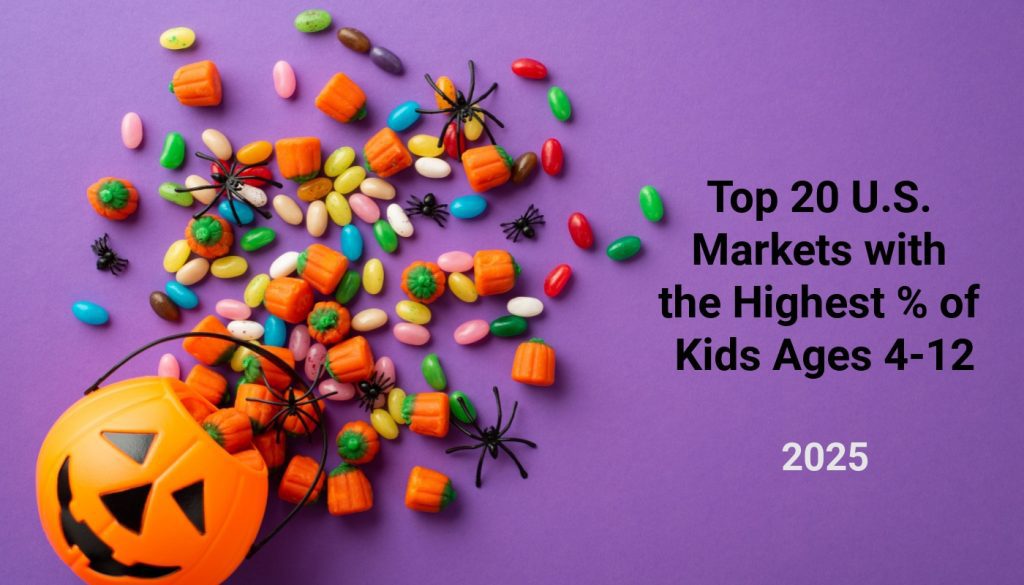
The Top 20 U.S. Markets for Trick-or-Treating (Ages 4-12)
Using the latest population estimates from PopStats, all 20 of the top metro areas with the highest percentage of kids ages 4 to 12 remain consistent with last year’s list, though their rankings have shifted slightly. Unlike last year, this update ranks metros using two decimal points for greater precision, which reveals a few ties.
This stability highlights ongoing demographic trends and the presence of family-centered communities. Here are the markets leading the way in 2025:
#1: Provo-Orem, UT | 15.34%
#2: Idaho Falls, ID | 14.01%
#3: Hinesville, GA | 13.75%
#4: Midland, TX | 13.71%
#5: Logan, UT-ID | 13.62%
#6: Ogden-Clearfield, UT | 13.53%
#7: Clarksville, TN-KY | 13.19%
#8: Laredo, TX | 13.12%
#9: Visalia, CA | 13.08%
#10: McAllen-Edinburg-Mission, TX | 13.06%
#11: Odessa, TX | 13.03%
#12: Merced, CA | 12.74%
#13: Sioux Falls, SD | 12.66%
#14: Twin Falls, ID | 12.65%
#15: Kennewick-Richland, WA | 12.62%
#16 (tie): Bakersfield, CA, and Elkhart-Goshen, IN | 12.56%
#18: Fresno, CA | 12.44%
#19: Killeen-Temple, TX | 12.41%
#20: Yakima, WA | 12.39%
Insights From the 2025 Population Data
- Utah stands out with three metros in the top 6, reflecting a young population.
- Texas cities are well represented, with 5 markets in the top 20, indicating strong family demographics.
- California is also prominent in the top 20, with several metro areas appearing across the rankings.
Overall, the consistency of these metro areas in the top 20 year after year suggests stable population trends among children ages 4-12.
Candy Spending on the Rise
If you’ve found yourself reaching for that bowl of candy at the office or sneaking a piece of chocolate at home, you’re in good company. Candy remains the centerpiece of Halloween celebrations, with spending expected to reach $3.9 billion in 2025. This growth reflects higher participation rates and rising per-person spending, making candy sales a key driver of Halloween retail success.
And let’s be honest: who can resist a sweet treat after lunch?
Interested in Data Like This?
Halloween 2025 is not just about costumes and candy; it reflects broader population trends and changing consumer behavior. With record spending, early shopping habits, and consistent concentrations of children in metro markets, Halloween continues to be a big cultural and economic event. Retailers can benefit from analyzing these trends to make the most of the season!
Interested in PopStats or Other Data?
The SiteSeer team can show you how combining population data, consumer trends, and other types of analytics can support smarter site selection, market planning, and location-based decisions.
Contact us today to learn more, or schedule a demo! Whether you’re in retail, real estate, grocery, or another chain business, we can help you turn insights into action and put the power of data analytics to work!